[Published April 19, 2023]
This is the third in our “Stanford Transportation 101” series – designed to help share why we do what we do here in LBRE and at Stanford Transportation. Read past articles on why Stanford charges for parking and the annual Cordon Count.
Ever wonder why Stanford Transportation conducts an annual commute survey? The information helps us better understand transportation behavior, gauge the effectiveness of our programs, and plan for future mobility options.
Thanks to your participation, we’ve created award-winning transportation programs and helped the environment by mitigating greenhouse gasses produced by the Stanford community.
Here are a few highlights from our 2022 survey for our commuting students, faculty, and staff, not including residents.
Complete our Survey for a Chance to Win $1,000
Stanford Transportation has distributed the commute survey to Stanford University students, employees, affiliates, Stanford Health Care, and Lucile Packard Children's Hospital employees for the past 21 years. This survey helps us gather valuable information that shapes our transportation program, meet reporting requirements for Stanford's General Use Permit, and enhance campus transportation services.
If you haven't participated in the survey yet, keep an eye out for an email from us in mid-Fall. The survey takes less than 5 minutes to complete. Enter your name for a chance to win one of several cash prizes, including a grand prize of $1,000!
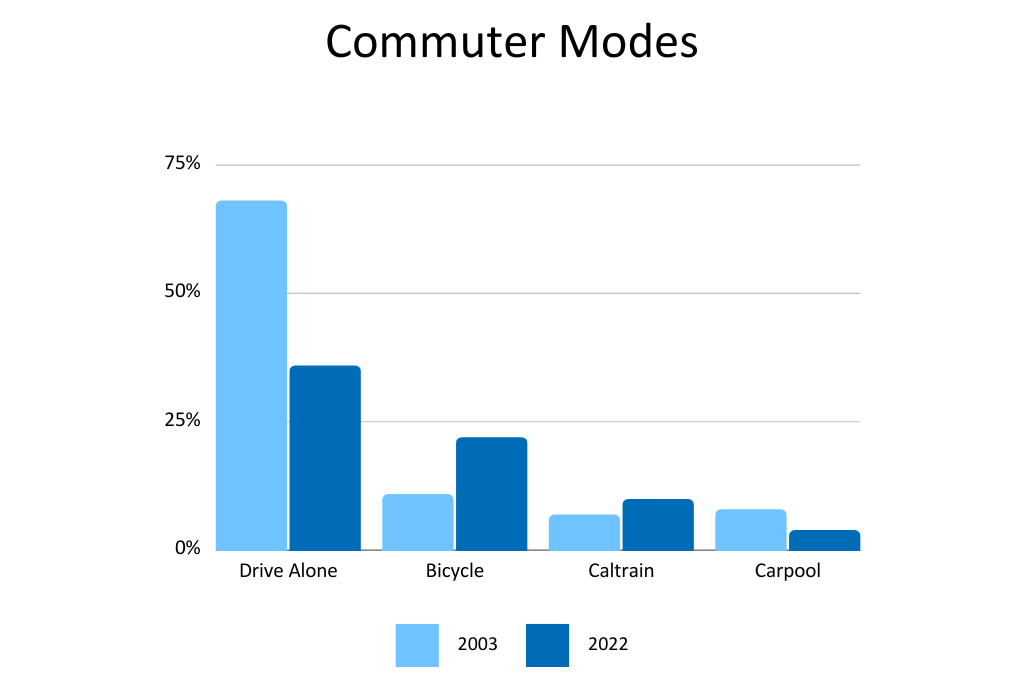
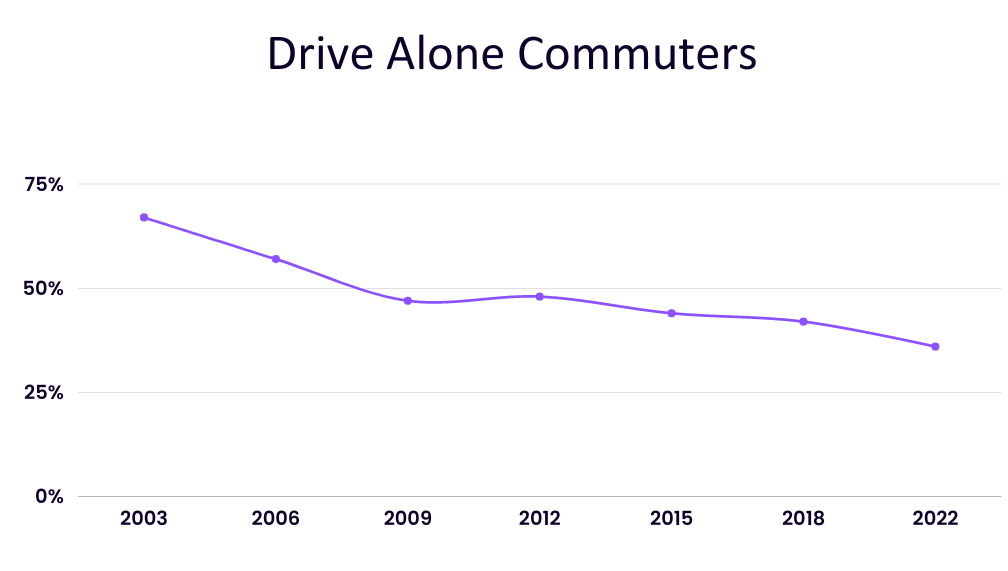
Thanks to our sustainable commute programs, the drive-alone rate for our commuting students, faculty, and staff went from 67% in 2003 to 36% in 2022.
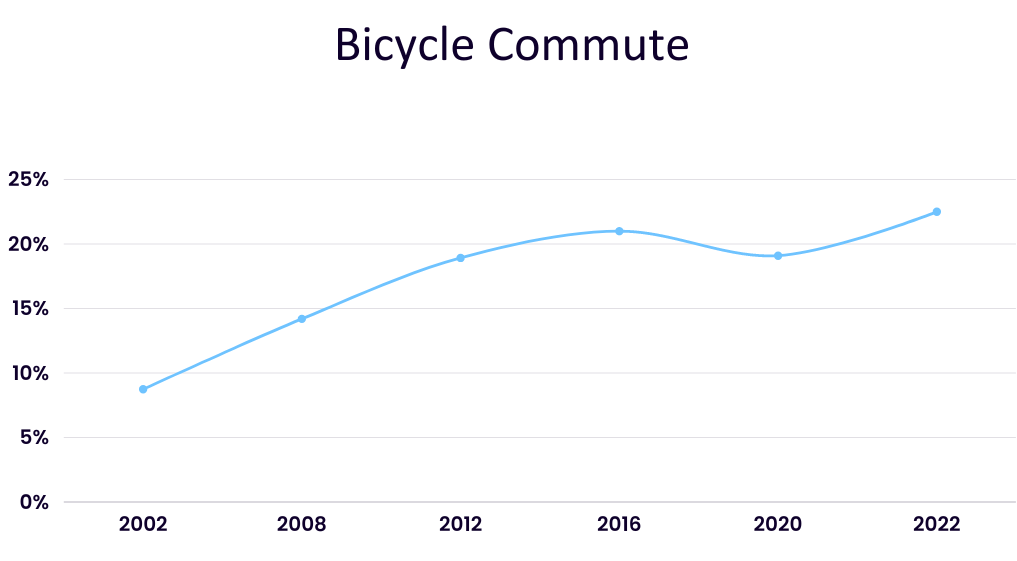
In 2022, bike commuting climbed from 9% in 2002 to an all-time high of 22%.
Since 2003, the number of commuters who drive alone to Stanford has decreased by nearly 50%.
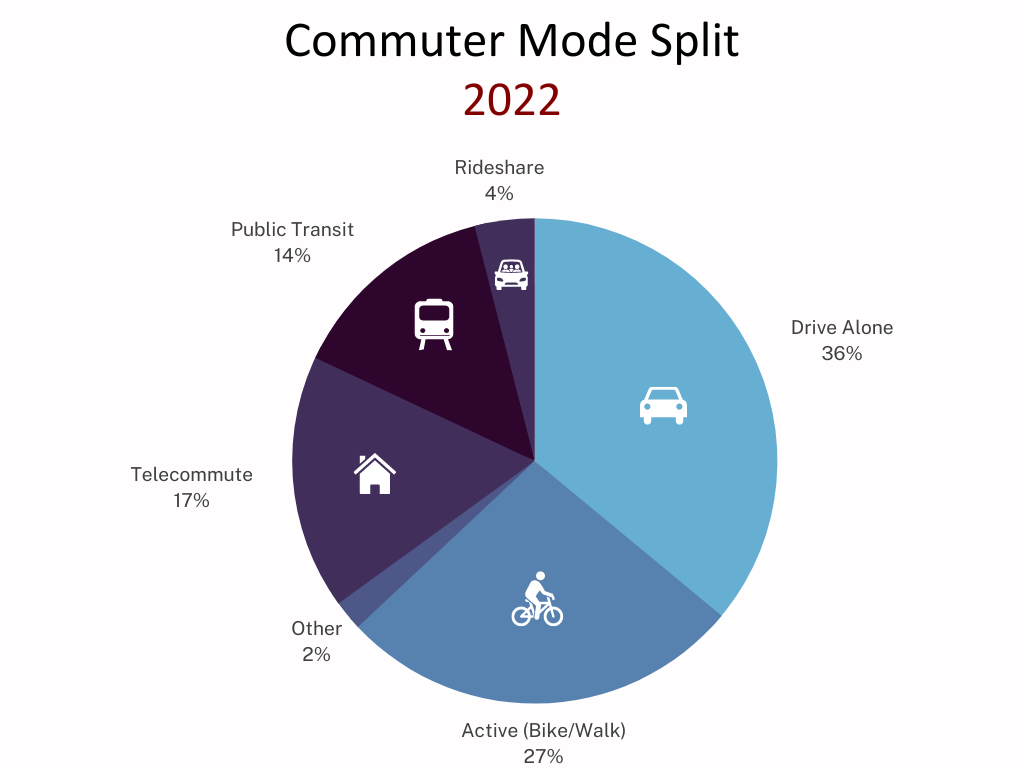
Last year, students, faculty, and staff commuted to Stanford in the following modes: